09 Oct 2012
Response of potato to fertilizer application and nutrient use efficiency in Inner Mongolia

Inner Mongolia autonomous region (IMAR) is one of the major potato production area in China. The planted area of potato in IMAR is now about 760,000 ha and the total production is 9.55 million tons. The lower yield of potato is not only restricted by water shortage, but by imbalanced fertilizer application. To realize the potato response to fertilizer application and nutrient use efficiency is important for nutrient management for potato production in IMAR.
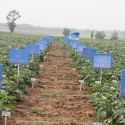
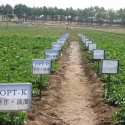
Field trials were conducted since 2002 in rainfed and irrigated potato in different regions in Inner Mongolia. Some soil physical and chemical properties were listed in Table 1. All the trials have four treatments including OPT treatment which was recommended based on soil testing by ASI procedures, and nutrient omitting plots, i.e. OPT-N, OPT-P, OPT-K.
Table 1 Physical and chemical properties of tested soils
Year | Site | Water regime | pH | OM % | Mineral N mg/L | Olsen P mg/L | Exchangeable K mg/L |
2002 | WUC* | Rainfed | 7.8 | 0.75 | 22.8 | 15.2 | 65.5 |
2003 | WUC | Rainfed | 8.6 | 1.2 | 28.0 | 13.1 | 77.0 |
2004 | WUC | Rainfed | 8.4 | 1.0 | 14.2 | 14.5 | 70.4 |
2004 | WUC | Rainfed | 8.5 | 1.0 | 8.5 | 18.4 | 78.2 |
2005 | WUC | Rainfed | 8.2 | 1.3 | 23.1 | 12.5 | 54.7 |
2006 | WUC | Rainfed | 7.8 | 1.05 | 40.8 | 16.5 | 144.7 |
2007 | WUC | Rainfed | 8.3 | 0.92 | 12.7 | 13.9 | 67.5 |
2007 | WUC | Rainfed | 8.4 | 1.0 | 21.6 | 14.5 | 70.4 |
2008 | WUC | Rainfed | 8.5 | 0.77 | 79.3 | 10.7 | 61.5 |
2011 | WUC | Rainfed | 8.3 | 0.97 | 21.6 | 18.6 | 89.3 |
2002 | WUC | Flood Irrigation | 8.3 | 0.66 | 10.5 | 14.7 | 76.5 |
2003 | WUC | Flood Irrigation | 8.4 | 1.1 | 16.1 | 18.5 | 83.4 |
2004 | WUC | Flood Irrigation | 8.4 | 1.2 | 27.2 | 10.2 | 54.7 |
2005 | WUC | Flood Irrigation | 8.4 | 1.45 | 20.0 | 9.65 | 66.4 |
2006 | WUC | Flood Irrigation | 7.9 | 0.4 | 22.9 | 20.9 | 58.6 |
2007 | WUC | Flood Irrigation | 8.4 | 1.45 | 28.3 | 24.9 | 108.8 |
2008 | WUC | Flood Irrigation | 8.5 | 1.27 | 30.3 | 18.9 | 123.5 |
2008 | CHYZ** | Flood Irrigation | 8.7 | 0.72 | 51.7 | 5.5 | 79.0 |
2008 | CHYZ | Sprinkler irrigation | 8.9 | 0.33 | 35.8 | 12.1 | 98.8 |
2009 | WUC | Flood Irrigation | 8.4 | 1.28 | 25.5 | 26.8 | 137.0 |
2009 | CHYZ | Flood Irrigation | 8.5 | 2.52 | 32.9 | 7.5 | 138.0 |
2009 | CHYZ | Sprinkler irrigation | 8.5 | 1.26 | 17.7 | 37.5 | 90.1 |
2010 | WUC | Flood Irrigation | 8.4 | 0.85 | 32.9 | 19.8 | 80.6 |
2010 | WUC | Sprinkler irrigation | 8.4 | 0.44 | 25.8 | 14.3 | 54.2 |
2011 | WUC | 8.1 | 1.29 | 16.4 | 14.3 | 80.4 |
Response of rainfed potato to fertilizer application and NUE
Ten experiments in rainfed potato (Table 2) showed that the tuber yield of OPT treatment was in the range of 9.6-21.4 t/ha with an average of 14.9 t/ha. Tuber yield was increased by an average of 3.2 t/ha, 2.4 t/ha and 2.2 t/ha or by 27.4%, 21.6% and 19.1%, respectively, compared with N, P and K omission plots. So, the first limiting factor for rainfed potato in Inner Mongolia was N, then P or K. The average agronomic efficiency (AE) of N, P and K for rainfed potato was 41.0 kg tuber/kg N, 55.0 kg tuber/kg P2O5 and 43.2 kg tuber/kg K2O. The average recovery efficiency (RE) of N, P and K fertilizer by rainfed potato was 33.1%, 16.8%, 50.1%. An average of 5.89 kg N, 1.44 kg P2O5 and 5.52 kg K2O was required for producing 1 t of tuber at the yield level of 14.9 t/ha.
Table 2 Yield response to fertilizer application and NUE in rainfed potato
Year | Nutrient applied (kg/ha) | Tuber(t/ha) | AE(kg/kg) | RE(%) | Nutrient requirement (kg/t) | |||||||||||
N | P2O5 | K2O | OPT | OPT -N | OPT -P | OPT -K | N | P2O5 | K2O | N | P2O5 | K2O | N | P2O5 | K2O | |
2002 | 64 | 45 | 45 | 11.8 | 9.6 | 10.6 | 10.6 | 34.4 | 27.3 | 26.7 | 24.6 | 13.1 | 39.4 | 7.36 | 1.65 | 6.37 |
2003 | 64 | 45 | 45 | 9.6 | 7.5 | 5.9 | 8.2 | 32.8 | 82.2 | 31.1 | 31.6 | 21.2 | 54.8 | 4.23 | 1.39 | 5.45 |
2004 | 45 | 30 | 30 | 14.4 | 12.6 | 13.8 | 12.9 | 39.9 | 21.1 | 50.2 | 37.3 | 13.8 | 41.1 | 6.87 | 1.13 | 5.02 |
2004 | 45 | 30 | 30 | 15.1 | 13.9 | 14.1 | 14.0 | 26.4 | 32.5 | 35.6 | 34.2 | 15.3 | 55.5 | 5.70 | 1.32 | 5.11 |
2005 | 45 | 30 | 30 | 19.3 | 15.7 | 15.8 | 18.5 | 80.6 | 117.2 | 29.2 | 35.2 | 18.3 | 41.6 | 4.79 | 1.23 | 4.18 |
2006 | 125 | 45 | 60 | 14.2 | 10.1 | 11.5 | 10.5 | 32.9 | 60.2 | 62.0 | 24.3 | 18.5 | 51.0 | 6.31 | 1.59 | 6.15 |
2007 | 125 | 45 | 60 | 10.3 | 9.1 | 8.6 | 7.3 | 9.3 | 36.6 | 50.0 | 25.7 | 14.6 | 62.2 | 6.92 | 1.42 | 7.71 |
2007 | 60 | 45 | 30 | 13.9 | 11.4 | 12.4 | 12.4 | 41.1 | 32.4 | 49.6 | 44.2 | 18.6 | 92.6 | 7.18 | 2.35 | 7.38 |
2008 | 105 | 60 | 90 | 21.4 | 11.9 | 17.3 | 16.4 | 90.3 | 68.1 | 56.2 | 51.3 | 18.7 | 23.6 | 5.50 | 1.32 | 3.36 |
2011 | 150 | 60 | 75 | 18.9 | 15.5 | 14.6 | 15.8 | 22.4 | 72.1 | 41.9 | 22.3 | 16.0 | 39.1 | 4.09 | 1.02 | 4.47 |
MAX | 150.0 | 60.0 | 90.0 | 21.4 | 15.7 | 17.3 | 18.5 | 90.3 | 117.2 | 62.0 | 51.3 | 21.2 | 92.6 | 7.36 | 2.35 | 7.71 |
MIN | 45.0 | 30.0 | 30.0 | 9.6 | 7.5 | 5.9 | 7.3 | 9.3 | 21.1 | 26.7 | 22.3 | 13.1 | 23.6 | 4.09 | 1.02 | 3.36 |
MEAN. | 82.8 | 43.5 | 49.5 | 14.9 | 11.7 | 12.5 | 12.6 | 41.0 | 55.0 | 43.2 | 33.1 | 16.8 | 50.1 | 5.89 | 1.44 | 5.52 |
Table 3 Yield response to fertilizer application and NUE in irrigated potato
Year | Site | Nutrient applied(kg/ha) | Tuber(t/ha) | AE(kg/kg) | RE(%) | Nutrient requirement (kg/t) | ||||||||||||
N | P2O5 | K2O | OPT | OPT-N | OPT-P | OPT-K | N | P2O5 | K2O | N | P2O5 | K2O | N | P2O5 | K2O | |||
2002 | WUC* | 128 | 90 | 90 | 34.4 | 31.1 | 33.2 | 33.6 | 25.6 | 13.3 | 8.6 | 28.5 | 12.6 | 41.1 | 5.89 | 1.41 | 4.89 | |
2003 | WUC | 143 | 92 | 120 | 32.4 | 27.9 | 27.9 | 29.6 | 31.3 | 48.5 | 23.0 | 36.3 | 12.8 | 38.3 | 5.71 | 1.17 | 5.64 | |
2004 | WUC | 120 | 90 | 120 | 26.0 | 20.4 | 23.7 | 23.8 | 46.3 | 26.0 | 18.5 | 31.5 | 11.2 | 43.5 | 4.88 | 1.01 | 5.81 | |
2005 | WUC | 120 | 90 | 120 | 37.5 | 31.3 | 31.3 | 34.0 | 52.1 | 68.5 | 29.2 | 39.3 | 19.8 | 56.1 | 4.40 | 1.58 | 6.63 | |
2006 | WUC | 150 | 90 | 120 | 31.5 | 25.6 | 25.4 | 25.3 | 39.1 | 67.9 | 51.6 | 29.6 | 17.0 | 42.9 | 6.91 | 1.62 | 7.91 | |
2007 | WUC | 180 | 60 | 120 | 30.6 | 23.8 | 24.9 | 25.9 | 37.5 | 95.4 | 39.1 | 34.6 | 10.6 | 47.6 | 7.58 | 1.21 | 9.44 | |
2008 | WUC | 150 | 75 | 105 | 12.9 | 9.9 | 10.2 | 10.1 | 20.0 | 36.0 | 26.9 | 37.1 | 9.2 | 47.1 | 9.05 | 1.87 | 8.72 | |
2008 | CHYZ** | 180 | 90 | 120 | 37.1 | 24.5 | 25.2 | 25.9 | 70.3 | 132.6 | 93.7 | 35.0 | 14.4 | 48.2 | 4.28 | 0.99 | 4.38 | |
2008 | CHYZ | 180 | 90 | 120 | 24.4 | 18.0 | 18.1 | 19.6 | 35.8 | 70.0 | 40.0 | 34.7 | 18.8 | 50.1 | 6.22 | 2.38 | 5.41 | |
2009 | WUC | 210 | 90 | 165 | 37.0 | 29.5 | 32.7 | 33.9 | 35.8 | 48.3 | 18.6 | 31.5 | 11.4 | 51.3 | 4.10 | 1.57 | 5.56 | |
2009 | CYZ | 210 | 150 | 150 | 35.9 | 27.0 | 26.1 | 26.6 | 42.3 | 65.2 | 62.2 | 39.4 | 13.2 | 53.1 | 4.74 | 2.51 | 5.24 | |
2009 | CYZ | 300 | 150 | 225 | 53.2 | 45.2 | 44.2 | 42.9 | 26.7 | 60.0 | 45.9 | 34.1 | 14.6 | 48.0 | 5.30 | 1.95 | 5.85 | |
2010 | WUC | 240 | 90 | 165 | 37.5 | 28.2 | 32.1 | 30.1 | 38.6 | 59.4 | 44.3 | 33.5 | 19.8 | 59.2 | 4.04 | 0.94 | 5.29 | |
2010 | WUC | 300 | 120 | 150 | 60.2 | 47.8 | 44.2 | 47.2 | 41.1 | 133.3 | 86.4 | 38.2 | 20.6 | 55.9 | 4.53 | 1.04 | 5.61 | |
2011 | WUC | 240 | 90 | 165 | 44.3 | 38.0 | 38.9 | 39.6 | 26.0 | 60.0 | 28.6 | 50.4 | 16.9 | 65.4 | 5.72 | 0.95 | 6.82 | |
MAX | 300.0 | 150.0 | 225.0 | 60.2 | 47.8 | 44.2 | 47.2 | 70.3 | 133.3 | 93.7 | 50.4 | 20.6 | 65.4 | 9.05 | 2.51 | 9.44 | ||
MIN | 120.0 | 60.0 | 90.0 | 12.9 | 9.9 | 10.2 | 10.1 | 20.0 | 13.3 | 8.6 | 28.5 | 9.2 | 38.3 | 4.04 | 0.94 | 4.38 | ||
MEAN | 190.1 | 97.1 | 137.0 | 35.7 | 28.6 | 29.2 | 29.9 | 37.9 | 65.6 | 41.1 | 35.6 | 14.9 | 49.9 | 5.56 | 1.48 | 6.21 | ||
Tuber yield increase of OPT treatment by percentage (%) over N, P and K omission plots was similar in rainfed and irrigated conditions, but yield increase by tonnage (t/ha) was much more in irrigated conditions than in rainfed conditions. The recommended rate of nutrients in irrigated field was 2.2-2.8 times of those in rainfed land, so the nutrient use efficiency including AE and RE was not improved compared with rainfed potato. The mean N and P requirement for producing 1 t of tuber was similar in ranfed and irrigated potato, while more K was required in irrigated potato.
Nutrient accumulation and distribution
Plant samples were collected periodically after emergence in rainfed and drip-irrigated potato in 2011 in Wuchuan to analyze nutrient content and accumulation in different parts of plants.
In irrigated potato, nitrogen uptake before 40 days after emergence was mainly accumulated in leaves and vines, accounting for 85-100% of total uptake. After that time N accumulation by tuber increased rapidly and N in leaves and vines decreased. At harvest, 71% of accumulated N in potato plant was in the tubers. P and K uptake by irrigated was similar to N. Before 40 DAE 76-100% of uptake P, 72-100% of uptake K was accumulated in leaves and vines. After that period tuber accumulated P and K increased. At harvest, 89% and 76% of P and K in potato plants accumulated in tuber.
In rainfed potato, 100% of nutrient N, P and K uptake before 30 DAE accumulated in leaves and vines and after 25 DAE nutrients in tuber increased rapidly and nutrients in leaves and vines decreased. At harvest, 80% of accumulated N, 91% of accumulated P and 91% of accumulated K in potato plant was in the tubers. More N and K accumulated in rainfed tubers than irrigated tubers.
The rapid uptake of N, P and K was in 25-57 DAE both in rainfed and irrigated potato. So nutrient N, P, K should be in sufficient supply before that period.
Mr. Duan (e-mail: yduan@ipni.ac.cn) is Professor, Mr. Tuo is Professor, Dr. Zhao is Professor, and Ms. Li is Assistant Professor with the Plant Nutrition and Analysis Institute, Inner Mongolia Academy of Agricultural and Animal Husbandry Sciences, China. Dr. Li (e-mail: sli@ipni.net) is Deputy Director, IPNI China Program, in Beijing.
References:
Rob Mikkelsen. Best Management Practices for Profitable Fertilization of Potatoes. Better Crops/Vol. 90 (2006, No. 2) :12~13
Duan Yu,Tuo Debao. Best Fertilizer Management Practices for Potato in Inner Mongolia.[M]. Inner Mongolia education press,2011.